Physical Address
304 North Cardinal St.
Dorchester Center, MA 02124
Physical Address
304 North Cardinal St.
Dorchester Center, MA 02124
Elastic Stack Kubernetes has become the go-to solution for centralized logging, monitoring, and observability in cloud-native environments. Leveraging the Elastic Cloud on Kubernetes (ECK) operator, you can simplify the deployment and management of Elasticsearch, Kibana, and Elastic Agents within your Kubernetes cluster. In this guide, we’ll walk you through installing the ECK operator, deploying a fully functional Elastic Stack cluster, setting up Kibana for visualization, and configuring Elastic Agents to monitor your Kubernetes resources efficiently. By the end of this tutorial, you’ll have a robust, scalable observability stack running on Kubernetes.
Elastic Stack, also known as the ELK Stack, is a collection of powerful open-source tools designed for search, logging, and analytics in modern IT environments. It consists of three primary components:
Additionally, the Elastic Stack now includes Elastic Agent for monitoring infrastructure, collecting logs, and metrics from various sources, making it a comprehensive observability platform. In this tutorial we will use Elastic Agent instead of Logstash.
In Kubernetes environments, Elastic Stack is widely used to monitor clusters, track application logs, and enable real-time analytics for better operational decision-making.
The Elastic Cloud on Kubernetes (ECK) operator is a Kubernetes operator that automates the deployment and management of Elastic Stack components—Elasticsearch, Kibana, and Elastic Agents—within a Kubernetes cluster.
Key features of ECK include:
In short, ECK bridges the gap between Kubernetes and Elastic Stack, making it easy to deploy, manage, and scale observability solutions on any Kubernetes cluster.
Before you start deploying the Elastic Stack using the ECK operator, ensure you have the following:
In this tutorial, we are using a GKE cluster with version v1.33.5-gke.2072000, so all resource definitions and configurations are customized to work with Google Kubernetes Engine.
The Elastic Cloud on Kubernetes (ECK) operator can be installed in several ways depending on your Kubernetes environment and preferences:
kubectl.For this tutorial, we will install the ECK operator using Helm, as it provides a flexible and easy way to manage updates and configuration.
Steps to Install ECK Using Helm
1. Add the Elastic Helm repository:
helm repo add elastic https://helm.elastic.co
helm repo update
2. Install the ECK operator in the elastic-system namespace:
helm install elastic-operator elastic/eck-operator -n elastic-system --create-namespace3. Verify the installation:
kubectl get pods -n elastic-systemYou should see the ECK operator pod running, indicating that the operator is ready to manage your Elastic Stack deployments.
akhilu@ip-10-10-43-18 vmzilla-eck % kubectl get pods -n elastic-system

NAME                 READY   STATUS    RESTARTS   AGE
elastic-operator-0   1/1     Running   0          17h
akhilu@ip-10-10-43-18 vmzilla-eck % Once the ECK operator is installed, the next step is to deploy an Elasticsearch cluster. Elasticsearch is the core of the Elastic Stack, storing and indexing all your data for search and analytics.
ECK allows you to define your cluster using a Kubernetes Custom Resource (CR). Below is an example YAML for a basic Elasticsearch cluster:
apiVersion: elasticsearch.k8s.elastic.co/v1
kind: Elasticsearch
metadata:
  name: quickstart
  namespace: default
spec:
  version: 9.2.0

  nodeSets:
  - name: default
    count: 3

    config:
      node.store.allow_mmap: false

    podTemplate:
      spec:
        containers:
        - name: elasticsearch
          resources:
            requests:
              cpu: "500m"
              memory: "2Gi"
            limits:
              cpu: "2"
              memory: "2Gi"
          env:
          - name: ES_JAVA_OPTS
            value: "-Xms1g -Xmx1g"

    volumeClaimTemplates:
    - metadata:
        name: elasticsearch-data
      spec:
        accessModes:
        - ReadWriteOnce
        storageClassName: hyperdisk-balanced-rwo
        resources:
          requests:
            storage: 20Gi
---
apiVersion: storage.k8s.io/v1
kind: StorageClass
metadata:
  name: hyperdisk-balanced-rwo
provisioner: pd.csi.storage.gke.io
volumeBindingMode: WaitForFirstConsumer
allowVolumeExpansion: true
parameters:
  type: hyperdisk-balanced
You can copy the above config to elasticsearch.yaml file and run below command to deploy Elasticsearch:
kubectl deploy -f elasticsearch.yamlYou can then run Kubectl get es to see if the cluster is deployed successfully. If everything goes fine you should see below output showing cluster in GREEN state.
akhilu@ip-10-10-43-18 vmzilla-eck % Kubectl get es
NAME         HEALTH   NODES   VERSION   PHASE   AGE
quickstart green 3 9.2.0 Ready 16hAs part of the Elastic Stack Setup on Kubernetes, Kibana provides the visual interface to explore and analyze the data stored in Elasticsearch. It allows you to create dashboards, visualize logs, and monitor metrics collected from your applications and infrastructure.
With the ECK operator, Kibana can be deployed using a Kubernetes Custom Resource (CR), which automatically connects it to your Elasticsearch cluster.
apiVersion: kibana.k8s.elastic.co/v1
kind: Kibana
metadata:
  name: quickstart
  namespace: default
spec:
  version: 9.2.0
  count: 1

  elasticsearchRef:
    name: quickstart

  config:
    server.publicBaseUrl: "http://localhost:5601"

  podTemplate:
    spec:
      containers:
      - name: kibana
        resources:
          requests:
            cpu: 200m
            memory: 512Mi
          limits:
            cpu: "1"
            memory: 1Gi
elasticsearchRef: References the Elasticsearch cluster (quickstart) that Kibana should connect to.
You can copy the above code to kibana-deployment.yaml and run below command to deploy Kibana.
kubectl apply -f kibana-deployment.yamlTip: For production setups, configure an Ingress or LoadBalancer service to access Kibana externally.
As part of the Elastic Stack Setup on Kubernetes, it is useful to deploy a sample workload that continuously generates logs. This allows us to validate log collection, ingestion, and visualization once monitoring is enabled using Elastic Agent.
In this section, we deploy a simple pod that writes timestamped log messages every second.
akhilu@ip-10-10-43-18 vmzilla-eck % cat vmpod.yml
apiVersion: v1
kind: Pod
metadata:
  name: vmpod
spec:
  containers:
  - name: count
    image: debian:bookworm-slim
    command:
    - /bin/sh
    - -c
    - |
      while true; do
        echo "$(date '+%Y-%m-%d %H:%M:%S.%3N') Thanks for visiting vmzilla!"
        sleep 1
      done
Copy the above config to vmpod.yml file and run below command to deploy it.
kubectl apply -f vmpod.ymlThis pod should generate logs like below:
akhilu@ip-10-10-43-18 vmzilla-eck % kubectl logs vmpod --tail=5 -f
2026-01-24 12:29:37.712 Thanks for visiting vmzilla!
2026-01-24 12:29:38.713 Thanks for visiting vmzilla!
2026-01-24 12:29:39.714 Thanks for visiting vmzilla!
2026-01-24 12:29:40.715 Thanks for visiting vmzilla!
2026-01-24 12:29:41.716 Thanks for visiting vmzilla!
2026-01-24 12:29:42.717 Thanks for visiting vmzilla!
^C%
This pod serves as a log-generating workload that we will use in the next section.
To complete the Elastic Stack Setup on Kubernetes, the final step is to deploy Elastic Agent. Elastic Agent is responsible for collecting container logs, Kubernetes events, and cluster metrics and sending them to Elasticsearch for analysis and visualization in Kibana.
Elastic Agent requires appropriate permissions to access Kubernetes APIs and node-level metrics. The following resources are created:
These permissions allow Elastic Agent to collect logs and metrics across the cluster securely.
RBAC Configuration for Elastic Agent.
apiVersion: rbac.authorization.k8s.io/v1
kind: ClusterRole
metadata:
  name: elastic-agent
rules:
- apiGroups: [""]
  resources:
  - namespaces
  - pods
  - nodes
  - nodes/metrics
  - nodes/proxy
  - nodes/stats
  - events
  verbs:
  - get
  - watch
  - list
- nonResourceURLs:
  - /metrics
  verbs:
  - get
  - watch
  - list
- apiGroups: ["coordination.k8s.io"]
  resources:
  - leases
  verbs:
  - get
  - create
  - update
- apiGroups: ["apps"]
  resources:
  - replicasets
  - statefulsets
  - deployments
  - daemonsets
  verbs:
  - get
  - list
  - watch
- apiGroups: ["batch"]
  resources:
  - jobs
  - cronjobs
  verbs:
  - get
  - list
  - watch
- apiGroups: ["storage.k8s.io"]
  resources:
  - storageclasses
  verbs:
  - get
  - list
  - watch
---
apiVersion: v1
kind: ServiceAccount
metadata:
  name: elastic-agent
  namespace: default
---
apiVersion: rbac.authorization.k8s.io/v1
kind: ClusterRoleBinding
metadata:
  name: elastic-agent
subjects:
- kind: ServiceAccount
  name: elastic-agent
  namespace: default
roleRef:
  kind: ClusterRole
  name: elastic-agent
  apiGroup: rbac.authorization.k8s.io
Once the above is deployed you can create a agent.yml file with below Agent configuration:
apiVersion: agent.k8s.elastic.co/v1alpha1
kind: Agent
metadata:
  name: elastic-agent
  namespace: default
spec:
  version: 9.2.0
  elasticsearchRefs:
  - name: quickstart
    namespace: default
  config:
    outputs:
      default:
        type: elasticsearch
        hosts:
          - https://quickstart-es-http:9200
        username: elastic
        password: ${ELASTICSEARCH_PASSWORD}
        ssl:
          verification_mode: none
  daemonSet:
    podTemplate:
      spec:
        automountServiceAccountToken: true
        serviceAccountName: elastic-agent
        containers:
        - name: agent
          securityContext:
            runAsUser: 0
          resources:
            requests:
              memory: "512Mi"
              cpu: "200m"
            limits:
              memory: "1Gi"
              cpu: "1000m"
          env:
          - name: NODE_NAME
            valueFrom:
              fieldRef:
                fieldPath: spec.nodeName
          - name: ELASTICSEARCH_PASSWORD
            valueFrom:
              secretKeyRef:
                name: quickstart-es-elastic-user
                key: elastic
          volumeMounts:
          - name: varlogcontainers
            mountPath: /var/log/containers
            readOnly: true
          - name: varlogpods
            mountPath: /var/log/pods
            readOnly: true
          - name: varlibdockercontainers
            mountPath: /var/lib/docker/containers
            readOnly: true
        volumes:
        - name: varlogcontainers
          hostPath:
            path: /var/log/containers
        - name: varlogpods
          hostPath:
            path: /var/log/pods
        - name: varlibdockercontainers
          hostPath:
            path: /var/lib/docker/containers
  config:
    id: 488e0b80-3634-11eb-8208-57893829af4e
    revision: 3
    agent:
      monitoring:
        enabled: true
        use_output: default
        logs: true
        metrics: true
    inputs:
    # Container logs collection
    - id: container-logs-input
      name: container-logs
      revision: 1
      type: filestream
      use_output: default
      data_stream:
        namespace: k8s
      streams:
      - id: kubernetes-container-logs
        data_stream:
          dataset: kubernetes.container_logs
          type: logs
        parsers:
        - container:
            stream: all
            format: auto
        paths:
        - /var/log/containers/*.log
        prospector:
          scanner:
            symlinks: true
        processors:
        - add_kubernetes_metadata:
            host: ${NODE_NAME}
            matchers:
            - logs_path:
                logs_path: "/var/log/containers/"
        - decode_json_fields:
            fields: ["message"]
            target: ""
            overwrite_keys: true
    # Kubernetes metrics collection
    - id: 678daef0-3634-11eb-8208-57893829af4e
      name: kubernetes-metrics
      revision: 1
      type: kubernetes/metrics
      use_output: default
      meta:
        package:
          name: kubernetes
          version: 0.2.8
      data_stream:
        namespace: k8s
      streams:
      - id: kubernetes/metrics-kubernetes.apiserver
        data_stream:
          dataset: kubernetes.apiserver
          type: metrics
        metricsets:
        - apiserver
        bearer_token_file: /var/run/secrets/kubernetes.io/serviceaccount/token
        hosts:
        - 'https://${env.KUBERNETES_SERVICE_HOST}:${env.KUBERNETES_SERVICE_PORT}'
        period: 30s
        ssl.certificate_authorities:
        - /var/run/secrets/kubernetes.io/serviceaccount/ca.crt
      - id: kubernetes/metrics-kubernetes.container
        data_stream:
          dataset: kubernetes.container
          type: metrics
        metricsets:
        - container
        add_metadata: true
        bearer_token_file: /var/run/secrets/kubernetes.io/serviceaccount/token
        hosts:
        - 'https://${env.NODE_NAME}:10250'
        period: 10s
        ssl.verification_mode: none
      - id: kubernetes/metrics-kubernetes.event
        data_stream:
          dataset: kubernetes.event
          type: metrics
        metricsets:
        - event
        period: 10s
        add_metadata: true
      - id: kubernetes/metrics-kubernetes.node
        data_stream:
          dataset: kubernetes.node
          type: metrics
        metricsets:
        - node
        add_metadata: true
        bearer_token_file: /var/run/secrets/kubernetes.io/serviceaccount/token
        hosts:
        - 'https://${env.NODE_NAME}:10250'
        period: 10s
        ssl.verification_mode: none
      - id: kubernetes/metrics-kubernetes.pod
        data_stream:
          dataset: kubernetes.pod
          type: metrics
        metricsets:
        - pod
        add_metadata: true
        bearer_token_file: /var/run/secrets/kubernetes.io/serviceaccount/token
        hosts:
        - 'https://${env.NODE_NAME}:10250'
        period: 10s
        ssl.verification_mode: none
      - id: kubernetes/metrics-kubernetes.system
        data_stream:
          dataset: kubernetes.system
          type: metrics
        metricsets:
        - system
        add_metadata: true
        bearer_token_file: /var/run/secrets/kubernetes.io/serviceaccount/token
        hosts:
        - 'https://${env.NODE_NAME}:10250'
        period: 10s
        ssl.verification_mode: none
      - id: kubernetes/metrics-kubernetes.volume
        data_stream:
          dataset: kubernetes.volume
          type: metrics
        metricsets:
        - volume
        add_metadata: true
        bearer_token_file: /var/run/secrets/kubernetes.io/serviceaccount/token
        hosts:
        - 'https://${env.NODE_NAME}:10250'
        period: 10s
        ssl.verification_mode: none
You can then run below command to deploy the Elastic Agent.
kubectl apply -f agent.ymlYou can then run below to see if the Agent is running and is in healthy state.
akhilu@ip-10-10-43-18 vmzilla-eck % kubectl get agent
NAME            HEALTH   AVAILABLE   EXPECTED   VERSION   AGE
elastic-agent   green    3           3          9.2.0     5h50m
akhilu@ip-10-10-43-18 vmzilla-eck %
Now that the Agent is running we can move to Kibana to monitor the cluster.
In order to log into Kibana you can first run the below command to find the password for elastic superuser.
akhilu@ip-10-10-43-18 vmzilla-eck % kubectl get secret quickstart-es-elastic-user -o go-template='{{.data.elastic | base64decode}}'

xB5YoTwVjr7jfiZXEenTCBvt%
Run the command below to forward local port 5601 → service port 5601.
akhilu@Akhils-MacBook-Pro NEW % kubectl port-forward service/quickstart-kb-http 5601
Forwarding from 127.0.0.1:5601 -> 5601
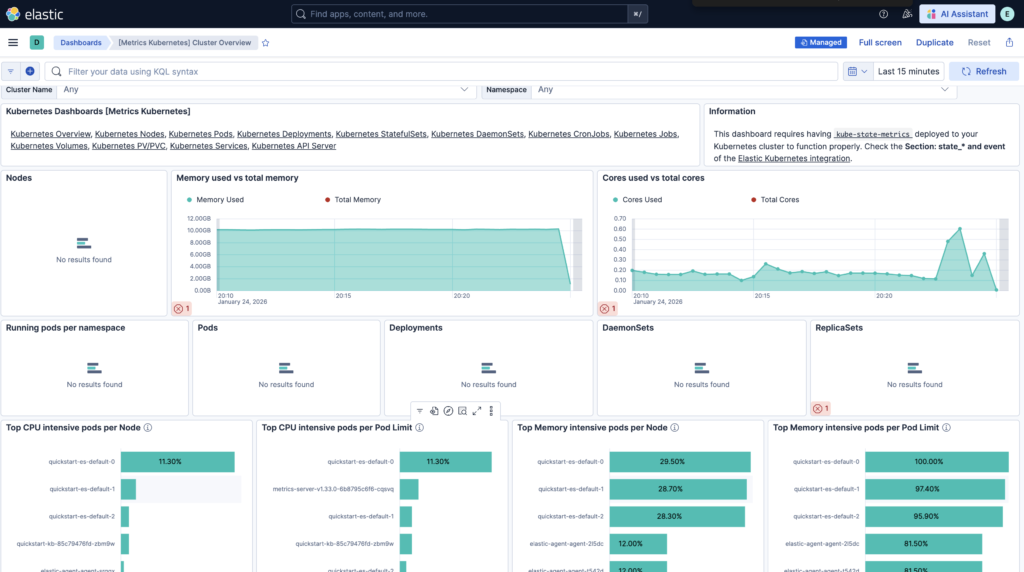
Forwarding from [::1]:5601 -> 5601Now your local machine can access the service as if it were running locally. Once you are logged into Kibana you can navigate to Integrations and search for Kubernetes integration and install it.
Once installed you can navigate to Dashboards -> [Metrics Kubernetes] Cluster Overview to monitor the Kubernetes cluster.
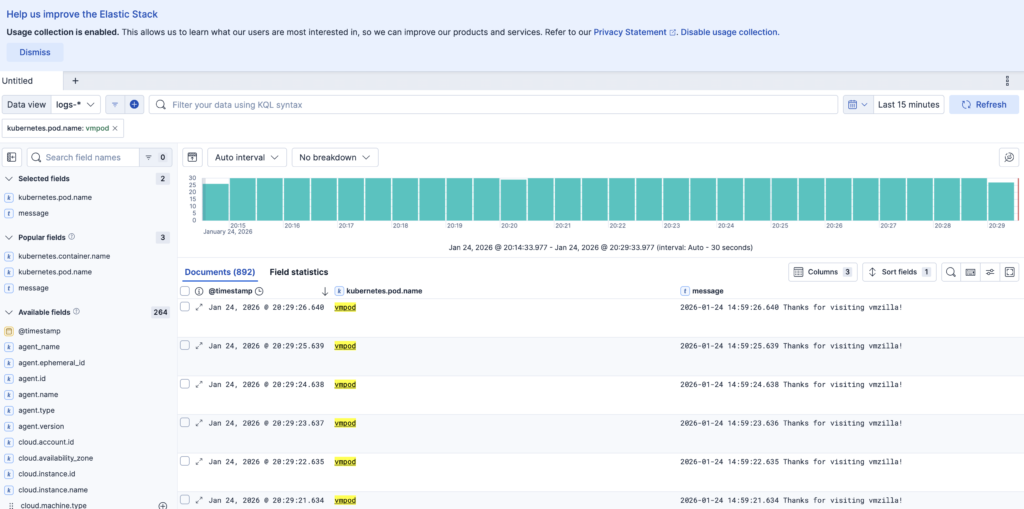
To check the pod logs you can navigate to Discover and select default logs-* Data View then filter the logs by kubernetes.pod.name: vmpod and messages field as shown in below image to check the logs for vmpod pod.
With Elasticsearch, Kibana, and Elastic Agent deployed using the ECK operator, you now have a complete observability solution running on Kubernetes. This setup provides centralized logging, real-time metrics, and deep visibility into your Kubernetes environment.