Physical Address
304 North Cardinal St.
Dorchester Center, MA 02124
Physical Address
304 North Cardinal St.
Dorchester Center, MA 02124

Modern IT environments generate a huge volume of logs across systems, applications, and services. Managing and analyzing these logs efficiently is crucial for performance monitoring, troubleshooting, and security. This is where the Elastic Stack comes in—a powerful suite of open-source tools designed to centralize and make sense of all your log data.
Previously known as the ELK Stack, the Elastic Stack combines several components that work together to collect, store, process, and visualize log and event data in real time.
The Elastic Stack is a collection of tools developed by Elastic that enables users to perform centralized logging and observability. It allows you to gather log data from multiple sources, analyze trends, and gain valuable insights into the health and performance of your infrastructure.
Rather than managing logs separately on each server, Elastic Stack provides a unified platform to view and analyze data from across your entire environment—making it easier to detect issues, correlate events, and respond quickly.
Each part of the Elastic Stack has a specific role:
This tutorial will walk you through installing the Elastic Stack on an Ubuntu 24.04 server. You’ll learn how to set up each core component, including Filebeat for log forwarding, and configure them to work together.
We’ll also cover how to:
By the end of this setup, you’ll have a fully functional centralized logging system ideal for testing, learning, or small-scale production use.
For this setup, we’re using three virtual machines, each configured with 4GB of RAM and 2 CPU cores, to host the Elasticsearch nodes. These VMs have been assigned the following hostnames:
log-db-01.vmzilla.comlog-db-02.vmzilla.comlog-db-03.vmzilla.comEach subdomain is properly mapped to its corresponding VM’s IP address via DNS, ensuring seamless network communication between the nodes.
1 server with 2 CPU cores, 8 GB of RAM for Logstash.
Letsencrypt SSL generated for elastic search and logstash server hostnames
There are multiple ways of installing Elasticsearch but we will refer to Debian package install method as outlined by the official Elastic docs.
By default, Ubuntu’s package repositories do not include the Elasticsearch components. To install them using APT, you’ll first need to add Elastic’s official package source to your system.
Elastic signs all of its packages with a GPG key to ensure they are authentic and haven’t been tampered with. Once this key is added and trusted by your system, Ubuntu’s package manager will be able to verify and install Elasticsearch securely.
In this section, you’ll add Elastic’s GPG key and repository to your server, preparing it to download and install Elasticsearch using the APT package manager.
Run following commands on all 3 Elasticsearch virtual machines.
wget -qO - https://artifacts.elastic.co/GPG-KEY-elasticsearch | sudo gpg --dearmor -o /usr/share/keyrings/elasticsearch-keyring.gpgYou may need to install the apt-transport-https package on Debian before proceeding:
sudo apt-get install apt-transport-httpsNow, add Elastic’s repository information to the sources.list.d directory so that APT can recognize and use it when searching for available packages:
echo "deb [signed-by=/usr/share/keyrings/elasticsearch-keyring.gpg] https://artifacts.elastic.co/packages/9.x/apt stable main" | sudo tee /etc/apt/sources.list.d/elastic-9.x.listThe signed-by=/usr/share/keyrings/elastic.gpg directive tells APT to use the GPG key you previously added to authenticate packages from the Elastic repository. This ensures that the Elasticsearch packages come from a trusted source and haven’t been altered.
After adding the repository, refresh your package index so APT can recognize and load the newly added Elastic source and install Elasticsearch service:
sudo apt-get update && sudo apt-get install elasticsearchNow that the Elasticsearch service is installed on all three virtual machines we can copy the SSL’s from local system to Elastic nodes.
rsync -avz /etc/certs/log-db-01.vmzilla.com root@log-db-01.vmzilla.com:/etc/elasticsearch/certs/
rsync -avz /etc/certs/log-db-02.vmzilla.com root@log-db-02.vmzilla.com:/etc/elasticsearch/certs/
rsync -avz /etc/certs/log-db-03.vmzilla.com root@log-db-03.vmzilla.com:/etc/elasticsearch/certs/
Now on log-db-01.vmzilla.com you can run the below command to start the Elasticsearch service.
systemctl daemon-reload
systemctl enable elasticsearch
systemctl start elasticsearch
You can then use the elasticsearch-reset-password script to reset the password for the elastic user. I am settings the password to testing.
root@log-db-01:~# /usr/share/elasticsearch/bin/elasticsearch-reset-password -i -u elastic
This tool will reset the password of the [elastic] user.
You will be prompted to enter the password.
Please confirm that you would like to continue [y/N]
Once the password is set we can check if the service is running using the below command:
root@logs1:/usr/share/elasticsearch/bin# curl --cacert /etc/elasticsearch/certs/http_ca.crt -u elastic:khatarnak https://localhost:9200
{
  "name" : "logs1.vmzilla.com",
  "cluster_name" : "elasticsearch",
  "cluster_uuid" : "KeMGwdkMR_6VVW17Me_DKA",
  "version" : {
    "number" : "9.1.4",
    "build_flavor" : "default",
    "build_type" : "deb",
    "build_hash" : "0b7fe68d2e369469ff9e9f344ab6df64ab9c5293",
    "build_date" : "2025-09-16T22:05:19.073893347Z",
    "build_snapshot" : false,
    "lucene_version" : "10.2.2",
    "minimum_wire_compatibility_version" : "8.19.0",
    "minimum_index_compatibility_version" : "8.0.0"
  },
  "tagline" : "You Know, for Search"
}
When the Elasticsearch service is installed the below folder and certs are created by default.
root@log-db-01:~# ls -la /etc/elasticsearch/certs/
total 36
drwxr-x--- 3 root elasticsearch  4096 Oct  3 06:33 .
drwxr-s--- 4 root elasticsearch  4096 Oct  3 10:07 ..
-rw-rw---- 1 root elasticsearch 10093 Oct  3 05:14 http.p12
-rw-rw---- 1 root elasticsearch  1939 Oct  3 05:14 http_ca.crt
-rw-rw---- 1 root elasticsearch  5854 Oct  3 05:14 transport.p12
We need to copy the above certs from log-db-01.vmzilla.com to log-db-02.vmzilla.com and log-db-03.vmzilla.com so that all three nodes have the same secure settings for inter node communication.
for host in log-db-02.vmzilla.com log-db-03.vmzilla.com; do
  scp /etc/elasticsearch/certs/http.p12 \
      /etc/elasticsearch/certs/http_ca.crt \
      /etc/elasticsearch/certs/transport.p12 \
      root@$host:/etc/elasticsearch/certs/
done
The Elasticsearch keystore is a secure storage mechanism used by Elasticsearch to safely store sensitive settings, such as passwords, API keys, and encryption secrets, that you don’t want exposed in plain text in configuration files like elasticsearch.yml.
Now that we are using same CA and transport certificate from log-db-01.vmzilla.com on log-db-02.vmzilla.com and log-db-03.vmzilla.com, we also need to copy the passwords related to SSL/TLS configuration for transport layer security.
To list values stored in log-db-01.vmzilla.com nodes key store run the below command.
root@log-db-01:~# /usr/share/elasticsearch/bin/elasticsearch-keystore list
autoconfiguration.password_hash
keystore.seed
xpack.security.http.ssl.keystore.secure_password
xpack.security.transport.ssl.keystore.secure_password
xpack.security.transport.ssl.truststore.secure_password
To list the password associated with xpack.security.transport.ssl.keystore.secure_password and xpack.security.transport.ssl.truststore.secure_password run the below commands:
root@log-db-01:~# /usr/share/elasticsearch/bin/elasticsearch-keystore show xpack.security.transport.ssl.keystore.secure_password
qVpnOOHwQ9G8wvksWWFq_g
root@log-db-01:~#
root@log-db-01:~# /usr/share/elasticsearch/bin/elasticsearch-keystore show xpack.security.transport.ssl.truststore.secure_password
qVpnOOHwQ9G8wvksWWFq_g
root@log-db-01:~#
On log-db-02.vmzilla.com and log-db-03.vmzilla.com run the below command to delete the existing password for xpack.security.transport.ssl.keystore.secure_password and xpack.security.transport.ssl.truststore.secure_password and update the same password from log-db-01.vmzilla.com.
root@log-db-02:/etc/elasticsearch/certs# /usr/share/elasticsearch/bin/elasticsearch-keystore remove xpack.security.transport.ssl.keystore.secure_password
root@log-db-02:/etc/elasticsearch/certs# /usr/share/elasticsearch/bin/elasticsearch-keystore remove xpack.security.transport.ssl.truststore.secure_password
root@log-db-02:/etc/elasticsearch/certs#
root@log-db-02:/etc/elasticsearch/certs#
root@log-db-02:/etc/elasticsearch/certs# /usr/share/elasticsearch/bin/elasticsearch-keystore add xpack.security.transport.ssl.keystore.secure_password
Enter value for xpack.security.transport.ssl.keystore.secure_password:
root@log-db-02:/etc/elasticsearch/certs#
root@log-db-02:/etc/elasticsearch/certs#
root@log-db-02:/etc/elasticsearch/certs# /usr/share/elasticsearch/bin/elasticsearch-keystore add xpack.security.transport.ssl.truststore.secure_password
Enter value for xpack.security.transport.ssl.truststore.secure_password:
Now remove the existing configuration from /etc/elasticsearch/elasticsearch.yml on log-db-01.vmzilla.com and add the below configuration:
# cluster.name will be the name of cluster. This will be same for all nodes in the cluster
cluster.name: my-application

# node.name is to set the name of node. Each node name will be unique.
node.name: log-db-01.vmzilla.com

# Below are the Elasticsearch data and log directory
path.data: /var/lib/elasticsearch
path.logs: /var/log/elasticsearch

# You can use the below settings to customize the port and the IP the service listens to. In our testing we have configured it to listen to all IP
network.host: 0.0.0.0
http.port: 9200

# discovery.seed_hosts provides a list of the addresses of the master-eligible nodes in the cluster. May also be a single string containing the addresses separated by commas. Each address has the format host:port or host
discovery.seed_hosts: ["log-db-01.vmzilla.com","log-db-02.vmzilla.com","log-db-03.vmzilla.com"]

# Enable security features
xpack.security.enabled: true
xpack.security.enrollment.enabled: true

# Enable encryption for HTTP API client connections, such as Kibana, Logstash, and Agents
xpack.security.http.ssl.enabled: true
xpack.security.http.ssl.certificate: /etc/elasticsearch/certs/log-db-01.vmzilla.com/fullchain1.pem
xpack.security.http.ssl.key: /etc/elasticsearch/certs/log-db-01.vmzilla.com/privkey1.pem
xpack.security.http.ssl.certificate_authorities: /etc/elasticsearch/certs/log-db-01.vmzilla.com/chain1.pem

# Enable encryption and mutual authentication between cluster nodes
xpack.security.transport.ssl:
  enabled: true
  verification_mode: certificate
  keystore.path: certs/transport.p12
  truststore.path: certs/transport.p12

# Additional nodes can still join the cluster later
cluster.initial_master_nodes: ["log-db-01.vmzilla.com","log-db-02.vmzilla.com","log-db-03.vmzilla.com"]

# Allow HTTP API connections from anywhere
# Connections are encrypted and require user authentication
http.host: 0.0.0.0

# Allow other nodes to join the cluster from anywhere
# Connections are encrypted and mutually authenticated
transport.host: 0.0.0.0

xpack.security.http.ssl.verification_mode: certificate
#----------------------- END SECURITY AUTO CONFIGURATION -------------------------
You can also update /etc/elasticsearch/elasticsearch.yml on node log-db-02.vmzilla.com and log-db-03.vmzilla.com after updating node.name and path to the Let’s Encrypt SSL folder. Then you can run below commands on all three nodes starting with log-db-01.vmzilla.com to restart the service.
systemctl daemon-reload
systemctl enable elasticsearch
systemctl start elasticsearch
Once the service is started we can use the below curl call to query the cluster status and to ensure all nodes have joined the cluster.
root@log-db-01:~# curl  -u elastic:testing https://log-db-01.vmzilla.com:9200/_cluster/health?pretty
{
  "cluster_name" : "my-application",
  "status" : "green",
  "timed_out" : false,
  "number_of_nodes" : 3,
  "number_of_data_nodes" : 3,
  "active_primary_shards" : 3,
  "active_shards" : 6,
  "relocating_shards" : 0,
  "initializing_shards" : 0,
  "unassigned_shards" : 0,
  "unassigned_primary_shards" : 0,
  "delayed_unassigned_shards" : 0,
  "number_of_pending_tasks" : 0,
  "number_of_in_flight_fetch" : 0,
  "task_max_waiting_in_queue_millis" : 0,
  "active_shards_percent_as_number" : 100.0
}
The above output shows that Elasticsearch cluster and been setup.
As recommended in the official documentation, Kibana should be installed only after Elasticsearch. This sequence ensures that all required dependencies are properly set up, allowing Kibana to connect and function correctly with the Elasticsearch backend.
Run the below command on dashboard.vmzilla.com server to download and install the public signing key:
wget -qO - https://artifacts.elastic.co/GPG-KEY-elasticsearch | sudo gpg --dearmor -o /usr/share/keyrings/elasticsearch-keyring.gpgYou may need to install the apt-transport-https package on Debian before proceeding:
sudo apt-get install apt-transport-httpsSave the repository definition to /etc/apt/sources.list.d/elastic-9.x.list:
echo "deb [signed-by=/usr/share/keyrings/elasticsearch-keyring.gpg] https://artifacts.elastic.co/packages/9.x/apt stable main" | sudo tee /etc/apt/sources.list.d/elastic-9.x.list
Run below command to install Kibana
sudo apt-get update && sudo apt-get install kibanaOnce Kibana is installed run the below command on log-db-01.vmzilla.com to update the password for Kibana user. In our case we have set the password as ‘passwd’. In production please use stronger password.
root@log-db-01:~# /usr/share/elasticsearch/bin/elasticsearch-reset-password -i -u kibana_system
This tool will reset the password of the [kibana_system] user.
You will be prompted to enter the password.
Please confirm that you would like to continue [y/N]y


Enter password for [kibana_system]:
Re-enter password for [kibana_system]:
Password for the [kibana_system] user successfully reset.
Once the Kibana user password is updated you can run the below command on Kibana server dashboard.vmzilla.com to download CA certificate used by Let’s Encrypt so that Kibana service can connect to Elasticsearch securely.
wget https://letsencrypt.org/certs/isrgrootx1.pem -O /etc/kibana/lets-encrypt-ca.pemNow you can edit the Kibana configuration file located at /etc/kibana/kibana.yml and update the following values.
# This setting specifies the port Kibana use.
server.port: 5601

# The default is 'localhost', which usually means remote machines will not be able to connect.
server.host: "0.0.0.0"

# The Kibana server's name. This is used for display purposes.
server.name: "dashboard.vmzilla.com"

# The URLs of the Elasticsearch instances to use for all your queries.
elasticsearch.hosts: ["https://log-db-01.vmzilla.com:9200","https://log-db-02.vmzilla.com:9200","https://log-db-03.vmzilla.com:9200"]

# The username and password your Kibana user need to authenticate with Elasticsearch
elasticsearch.username: "kibana_system"
elasticsearch.password: "passwd"

# Certificate authority for your Elasticsearch instance.
elasticsearch.ssl.certificateAuthorities: [ "/etc/kibana/lets-encrypt-ca.pem" ]

# To disregard the validity of SSL certificates, change this setting's value to 'none'.
elasticsearch.ssl.verificationMode: full
Once this configuration is updated you can run the following commands to start the Kibana service.
sudo /bin/systemctl daemon-reload
sudo /bin/systemctl enable kibana.service
sudo systemctl start kibana.service
Now the Kibana service is running on 5601. We can further install Nginx and use it as reverse proxy to access the Kibana service using port 80 or 443.
You can install the Nginx service using below command:
apt install nginxThe next step is to set up an Nginx server block configuration file. For this example, we’ll name the file your_domain, but you may want to choose a more meaningful name—especially if you’ve already configured a fully qualified domain name (FQDN) and DNS records for your server. In that case, naming the file after your domain (e.g., kibana.example.com) can help keep things organized.
Open the file using VIM or your preferred text editor to begin creating the server block:
vim /etc/nginx/sites-available/dashboard.vmzilla.comInsert the following configuration into your server block file. Make sure to replace your_domain with your server’s actual FQDN or public IP address.
This setup tells Nginx to forward incoming HTTP requests to Kibana, which runs locally on port 5601:
server {
    listen 80;

    server_name dashboard.vmzilla.com www.dashboard.vmzilla.com;

    location / {
        proxy_pass http://localhost:5601;
        proxy_http_version 1.1;
        proxy_set_header Upgrade $http_upgrade;
        proxy_set_header Connection 'upgrade';
        proxy_set_header Host $host;
        proxy_cache_bypass $http_upgrade;
    }
}
To activate the new server block, create a symbolic link in the sites-enabled directory.
ln -s /etc/nginx/sites-available/dashboard.vmzilla.com /etc/nginx/sites-enabled/dashboard.vmzilla.comThen check the configuration for syntax errors:
root@dashboard:~# sudo nginx -t
nginx: the configuration file /etc/nginx/nginx.conf syntax is ok
nginx: configuration file /etc/nginx/nginx.conf test is successful
If any errors are reported in your output, go back and double check that the content you placed in your configuration file was added correctly. Once you see syntax is ok in the output, go ahead and restart the Nginx service:
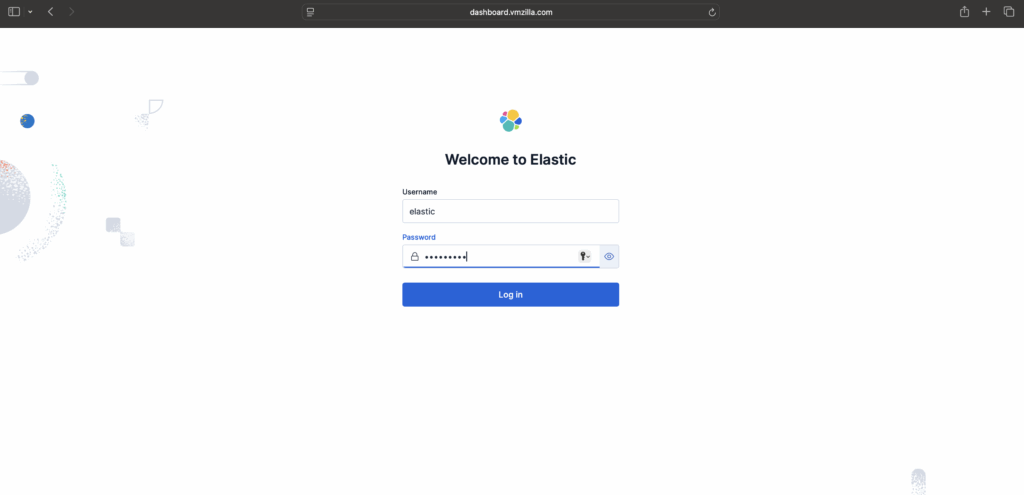
sudo systemctl reload nginxYou can then access the Kibana login page using your domain. (dashboard.vmzilla.com) in this case.
While Beats can transmit data straight to Elasticsearch, many users prefer routing it through Logstash. This approach offers greater flexibility, allowing you to gather logs from multiple sources, standardize the data format, and forward it to Elasticsearch or other storage solutions with ease.
On Logstash server run below command to download and install the Public Signing Key:
wget -qO - https://artifacts.elastic.co/GPG-KEY-elasticsearch | sudo gpg --dearmor -o /usr/share/keyrings/elastic-keyring.gpgYou may need to install the apt-transport-https package on Debian before proceeding:
sudo apt-get install apt-transport-https
Save the repository definition to /etc/apt/sources.list.d/elastic-9.x.list:
echo "deb [signed-by=/usr/share/keyrings/elastic-keyring.gpg] https://artifacts.elastic.co/packages/9.x/apt stable main" | sudo tee -a /etc/apt/sources.list.d/elastic-9.x.list
Run sudo apt-get update and the repository is ready for use. You can install it with:
sudo apt-get update && sudo apt-get install logstash
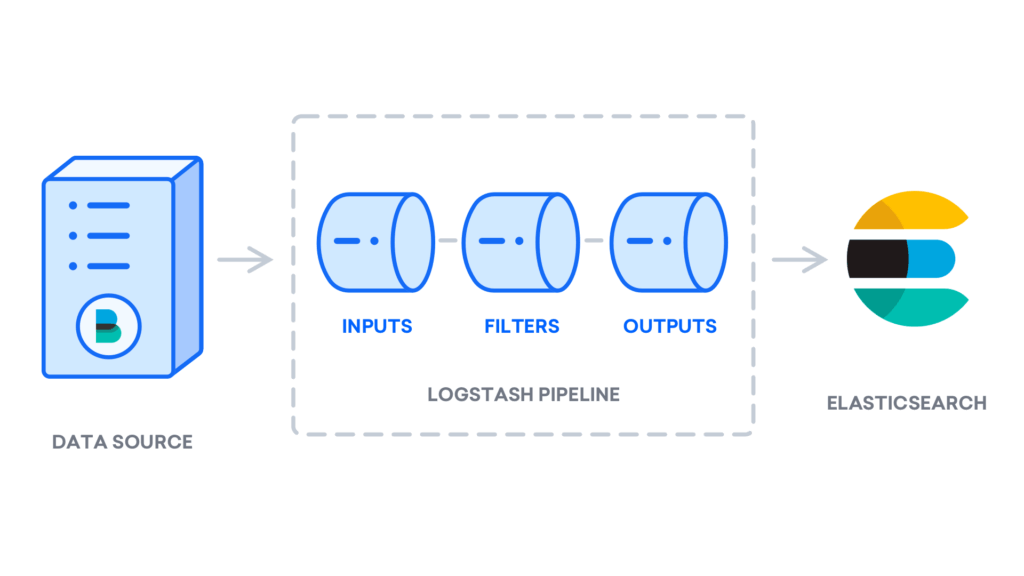
Once Logstash is installed, the next step is configuring it to handle your data pipeline. Configuration files are typically located in the /etc/logstash/conf.d directory. To get familiar with the syntax, Elastic offers a detailed configuration reference that’s worth exploring. Think of Logstash as a data pipeline — it ingests data from various sources, processes it, and then delivers it to a specified destination, such as Elasticsearch. Every Logstash pipeline includes two essential components: input and output, with an optional filter stage. Input plugins gather data from sources, filter plugins transform or enrich the data, and output plugins send the final data to its target location.
Create a new configuration file named 02-beats-input.conf to define and set up the Filebeat input settings.
vim /etc/logstash/conf.d/02-beats-input.confAdd the following input configuration, which sets up a Beats input to listen for incoming data on TCP port 5044.
input {
  beats {
    port => 5044
  }
}
After saving and closing the file, proceed by creating a new configuration file named 30-elasticsearch-output.conf. This file will define how Logstash sends data to Elasticsearch.
vim /etc/logstash/conf.d/30-elasticsearch-output.confAdd the following output configuration. This setup tells Logstash to send incoming data from Beats to an Elasticsearch instance running on localhost:9200. The data will be stored in an index named after the specific Beat being used — in this case, Filebeat.
output {
  if [@metadata][pipeline] {
    elasticsearch {
      hosts => ["https://log-db-01.vmzilla.com:9200", "https://log-db-02.vmzilla.com:9200", "https://log-db-03.vmzilla.com:9200"]
      user => "elastic"
      password => "testing"
      ssl_enabled => true
      ssl_verification_mode => "none"
      manage_template => false
      index => "%{[@metadata][beat]}-%{[@metadata][version]}-%{+YYYY.MM.dd}"
      pipeline => "%{[@metadata][pipeline]}"
    }
  } else {
    elasticsearch {
      hosts => ["https://log-db-01.vmzilla.com:9200", "https://log-db-02.vmzilla.com:9200", "https://log-db-03.vmzilla.com:9200"]
      user => "elastic"
      password => "testing"
      ssl_enabled => true
      ssl_verification_mode => "none"
      manage_template => false
      index => "%{[@metadata][beat]}-%{[@metadata][version]}-%{+YYYY.MM.dd}"
    }
  }
}
Save and close the file.
Test your Logstash configuration with this command:
sudo -u logstash /usr/share/logstash/bin/logstash --path.settings /etc/logstash -tIf your configuration contains no syntax errors, the output will show Config Validation Result: OK, and Logstash will exit after a few seconds. If you don’t see this message, review the output for any error details and update your configuration accordingly. Keep in mind that warnings from OpenJDK may appear, but these typically do not impact Logstash and can be safely ignored.
Once your configuration passes validation, you can start and enable Logstash to apply the new settings:
sudo systemctl start logstash
sudo systemctl enable logstashThe Elastic Stack relies on a set of lightweight data shippers called Beats to gather information from different sources and send it to Logstash or Elasticsearch. Elastic currently offers several Beats, including:
In this tutorial, we will focus on using Filebeat to forward local log data to the Elastic Stack.
To get started, install Filebeat using the apt package manager:
sudo apt install filebeatNext, configure Filebeat to send data to Logstash by editing the default configuration file included with Filebeat.
Start by opening the Filebeat configuration file:
vim /etc/filebeat/filebeat.ymlFilebeat offers multiple output options, but it typically sends data either directly to Elasticsearch or to Logstash for further processing. In this tutorial, we’ll configure Filebeat to forward data to Logstash, allowing for additional processing before it reaches Elasticsearch. Since Filebeat won’t send data directly to Elasticsearch, we’ll disable that output by locating the output.elasticsearch section in the configuration file and commenting out the relevant lines by adding a # at the beginning.
...
#output.elasticsearch:
  # Array of hosts to connect to.
  #hosts: ["localhost:9200"]
...
Next, set up the output.logstash section by uncommenting the lines output.logstash: and hosts: ["localhost:5044"]—simply remove the # at the beginning of each line. This configures Filebeat to send data to Logstash running on your Elastic Stack server at port 5044, which matches the input port we defined earlier in Logstash.
output.logstash:
  # The Logstash hosts
  hosts: ["localhost:5044"]
After saving and closing the configuration file, you can extend Filebeat’s capabilities using Filebeat modules. For this tutorial, we’ll enable the system module, which is designed to collect and parse logs generated by the system logging service on most Linux distributions.
Let’s go ahead and enable it:
sudo filebeat modules enable systemYou can see a list of enabled and disabled modules by running:
sudo filebeat modules list
Output
Enabled:
system

Disabled:
apache2
auditd
elasticsearch
icinga
iis
kafka
kibana
logstash
mongodb
mysql
nginx
osquery
postgresql
redis
traefik
...
Then edit /etc/filebeat/modules.d/system.yml and make sure the filesets you want are enabled (enabled: true).
For example, in /etc/filebeat/modules.d/system.yml
- module: system
  syslog:
    enabled: true
  auth:
    enabled: true
Next, configure the Filebeat ingest pipelines to parse log data before it’s sent through Logstash to Elasticsearch. To load the ingest pipeline for the system module, run the following command:
sudo filebeat setup --pipelines --modules systemNext, load the index template into Elasticsearch. An index in Elasticsearch is a collection of documents that share common properties and is identified by a unique name used to manage and query the data. The index template ensures consistent settings and mappings are automatically applied whenever a new index is created.
To load the template, run the following command:
sudo filebeat setup --index-management \
  -E output.logstash.enabled=false \
  -E 'output.elasticsearch.hosts=["https://log-db-01.vmzilla.com:9200","https://log-db-02.vmzilla.com:9200","https://log-db-03.vmzilla.com:9200"]' \
  -E output.elasticsearch.username=elastic \
  -E output.elasticsearch.password=testing \
  -E output.elasticsearch.ssl.verification_mode=none
Output:
Output
Index setup finished.Filebeat includes pre-built Kibana dashboards that make it easy to visualize your Filebeat data. Before using these dashboards, you’ll need to create an index pattern and load the dashboards into Kibana.
During this process, Filebeat connects to Elasticsearch to verify version details. If you are using Logstash for data processing, you’ll need to temporarily disable the Logstash output and enable the Elasticsearch output to successfully load the dashboards.
sudo filebeat setup \
  -E output.logstash.enabled=false \
  -E 'output.elasticsearch.hosts=["https://log-db-01.vmzilla.com:9200","https://log-db-02.vmzilla.com:9200","https://log-db-03.vmzilla.com:9200"]' \
  -E output.elasticsearch.username=elastic \
  -E output.elasticsearch.password=khatarnak \
  -E output.elasticsearch.ssl.verification_mode=none \
  -E setup.kibana.host="http://dashboard.vmzilla.com:5601"
You should receive output similar to this:
Output
Overwriting ILM policy is disabled. Set `setup.ilm.overwrite:true` for enabling.

Index setup finished.
Loading dashboards (Kibana must be running and reachable)
Loaded dashboards
Setting up ML using setup --machine-learning is going to be removed in 8.0.0. Please use the ML app instead.
See more: https://www.elastic.co/guide/en/elastic-stack-overview/current/xpack-ml.html
Loaded machine learning job configurations
Loaded Ingest pipelines
Now you can start and enable Filebeat:
sudo systemctl start filebeat
sudo systemctl enable filebeat
Once your Elastic Stack is properly configured, Filebeat will start forwarding your syslog and authorization logs to Logstash, which then indexes the data into Elasticsearch.
To confirm that Elasticsearch is receiving the data, run a query against the Filebeat index using the following command:
curl -u elastic:khatarnak https://log-db-01.vmzilla.com:9200/filebeat-*/_search?prettyYou should receive output similar to this:
Output

{
  "took" : 53,
  "timed_out" : false,
  "_shards" : {
    "total" : 2,
    "successful" : 2,
    "skipped" : 0,
    "failed" : 0
  },
  "hits" : {
    "total" : {
      "value" : 5000,
      "relation" : "eq"
    },
    "max_score" : 1.0,
    "hits" : [
      {
        "_index" : "filebeat-9.1.4-2025.10.03",
        "_id" : "kypSq5kBiarz4qODc5pM",
        "_score" : 1.0,
        "_source" : {
          "agent" : {
            "name" : "logs-stash-a",
            "id" : "35e22871-7abf-48dd-92bd-3884b7305c1b",
            "type" : "filebeat",
            "ephemeral_id" : "6b7da1e8-f248-4c5f-ad20-08c8a5c24641",
            "version" : "9.1.4"
          },
          "process" : {
            "name" : "gpasswd",
            "pid" : 3796
```
If your search returns zero results, it means Elasticsearch isn’t indexing any logs under the specified index. In this case, you should double-check your configuration for any possible issues. However, if you get the expected results, you can move forward to the next section where we’ll explore how to navigate various dashboards in Kibana.
Head back to the Kibana web interface that was set up earlier.
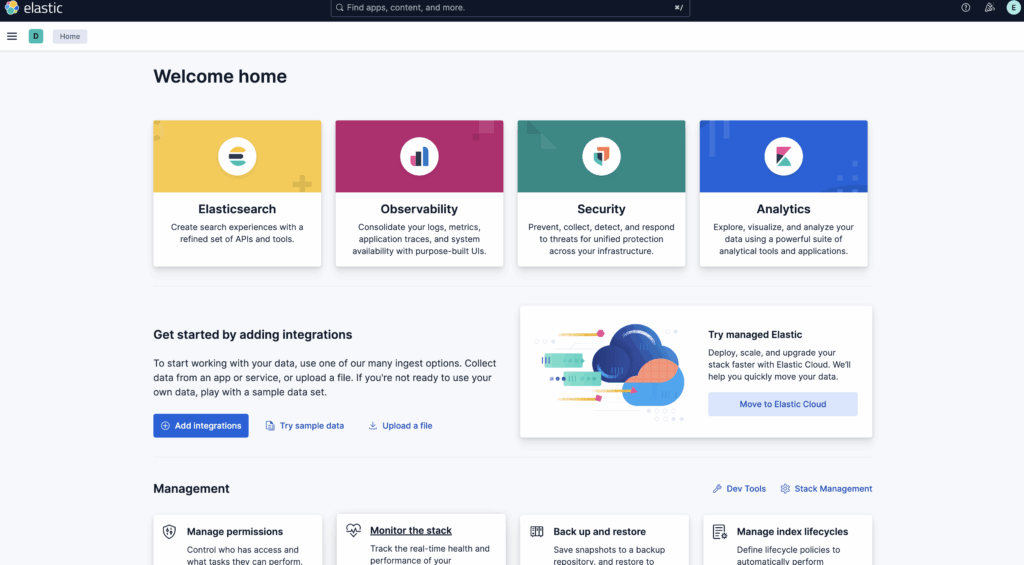
Open your preferred web browser and navigate to the fully qualified domain name (FQDN) or the public IP address assigned to your Kibana server. For example, we’ll use: http://dashboard.vmzilla.com/. If your previous session has expired, you’ll be prompted to log in again. After successfully signing in, the Kibana homepage should appear.
In the left-hand sidebar, click on Discover. If the menu isn’t visible, you might need to click the Expand icon located at the bottom left corner to reveal it.
Once you’re on the Discover page, choose the filebeat-* index pattern from the list to view data collected by Filebeat. By default, the page displays logs from the past 15 minutes. You’ll notice a histogram at the top representing log activity, with detailed log entries listed underneath.
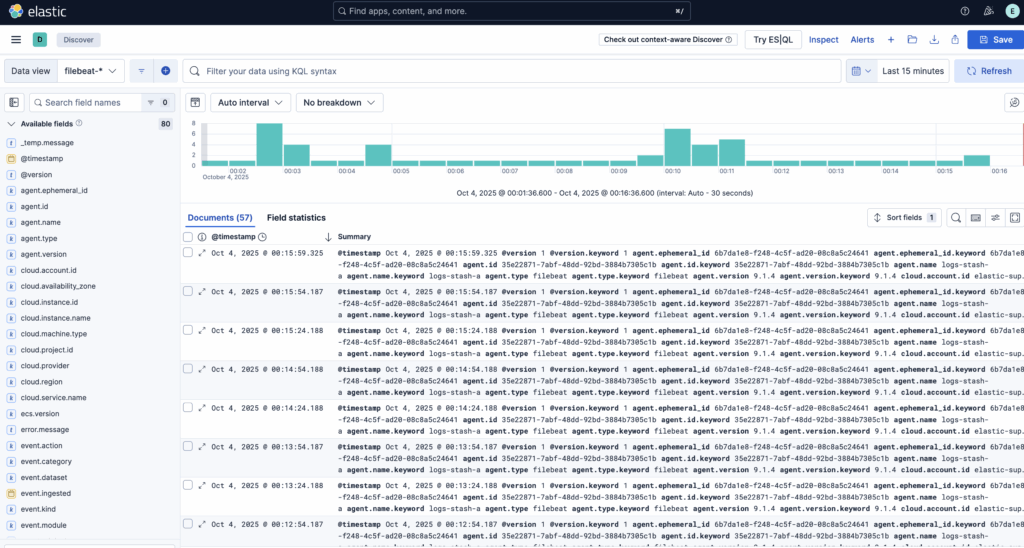
This section allows you to search, filter, and explore your log data, as well as begin customizing your dashboard. However, keep in mind that the data will be limited for now, since it’s currently only collecting syslog entries from the Elastic Stack server itself.
In this guide, you’ve seen how to set up and configure the Elastic Stack to collect and analyze system logs. Keep in mind that Logstash can receive a wide range of log types or indexed data using Beats. To make the most of this data, it’s recommended to use Logstash filters to parse and structure it—this ensures the information is uniform and easier for Elasticsearch to interpret and search through effectively.